5. 日志解读 Reading Logs
上传你的日志
找到日志
If you didn’t change the default folder, you can find the logs in:
C:\Users\用户名\Documents\Guild Wars 2\addons\arcdps\arcdps.cbtlogs
If you were to go to that folder, you would see something like this:

I have the encounter names as the folder names, as I think it makes it easier to find the particular logs. A log file itself will look something like the image below. If you don’t compress the logs, they will have .evtc-filetype instead of .zevtc.

上传日志
Now that you have located the file, head to https://dps.report/。 If you prefer the dark version, there is a button for that on top right. You will see the page open up as shown below. You can simply drag and drop the file into the box or you can click on the box and locate the file from your computer. Once you have uploaded a file and the website has parsed it, you can simply click on the link to open it.

When you click the link, you will see something like in the picture below. It is now also possible to make the logs anonymous by ticking the box saying Anonymous Report - Generate with fake player names and accounts."

Congratulations! Now you are ready to start reading and analysing your logs. I would still suggest that you get other people with experience to chip in if you want to improve. For logs related to raids and benchmarking, Snow Crows is probably your best bet for getting help with your logs. Snow Crows Discord Server。
For anything fractal-related, you are probably best off with asking people in the Discretize Discord Server。
日志界面 UI
I will be dividing this into multiple smaller sections. Skip if it seems redundant or obvious. Or read through it all lol, I am not your boss.
IF YOU HOVER OVER THE COLUMNS OR NUMBERS ON dps.report, IT WILL USUALLY SHOW YOU EXTRA INFORMATION!
基础信息 Basic Information
If there is a small, yellow/orange box with a question mark inside it on any of the parts, you can hover over it for information regarding that part as you can see below.
If it is not obvious on the page and this guide doesn’t help, you might find this tip helpful! With all this in mind, let’s go ahead and break down the UI of dps.report, part by part.

- The total health and how much the encounter had left at the end of the log. To see the percentage left, simply hover over the health bar. The result is straightforward; either you killed the boss or you didn’t. Duration is important to keep in mind when you are comparing logs as duration tells you a lot about the nature of the fight.
- Statistics will show you, well, statistics about the fight. Combat Replay will show you a “replay” of the fight from a top-down view. It gives you multiple options to see boons, attacks etc. so it can be extremely helpful in seeing if the party was stacking and if people were doing what they were supposed to do when they were supposed to do that thing.
- This part of the UI is EXTREMELY IMPORTANT when you start to analyse your logs. You can select the whole fight or the individual phases to see where everything went awry or to compare boons between phases one or two, for example. “Phase” usually means the phases when you were damaging the boss and “split” the phases when you were split up/not damaging the boss. The naming scheme changes from boss to boss but it’s chronological, so you’ll figure it out in no time.
- The players that partook in the encounter. You can see their character names, classes, weapon sets and relative stats here. The stats are relative in the sense that the person with the highest amount of
 治疗效果 ,
 坚韧 ,
坚韧 , 症状伤害 或
  增益效果 will be assigned the value of “10” when hovered over. This means that a single infusion that gives you +5 to any of those stats will have you at “10” if no one else in the group has more than that amount of that stat. If there are multiple people with varying amounts of any of the stats, the person with the highest amount will be assigned “10” and the people who are lower will have anything between 1-9. If someone has the number 7, for example, they would have between 70 % – 79 % of the amount that the person with 10 has. So if the player with 10 has 1100 坚韧 ,the person with 7 would have between 1070 and 1079 坚韧 。 It does, however seem that this has been recently changed on ArcDPS to include a threshold to show the values. Therefore this isn't as accurate way of deducting someone's stats as it was before.
一般统计 General Stats
In general stats, you can find interesting and useful statistics. It contains a lot of important and not-so-important information, depending on the encounter.
伤害统计 Damage Stats

- Sub stands for “subgroup”. In the squad window you can see a small number separating different subgroups. Subgroups affect boon distribution.
- This column stands for “Target Damage”, which is your DPS over the whole fight against the target。 Target is the boss, in this log it’s
 山谷守护者 。 At the bottom, you can see subgroup 1’s DPS against the target, subgroup 2’s DPS against the target and the whole squad’s DPS against the target.
 - Same as previous, but only power (direct) damage.
- Same as the previous two, but only condition damage.
- This column shows the defiance bar (breakbar) damage done to the target. Damage to defiance bar is equal to hard CC that hit the target (missing hits do NOT count)。
- Same as the previous columns, but includes all damage (also called cleave)。 If you have any adds on a fight (like Dhuum has Deathlings) and you hit them, that damage is added to your DPS in this section.
操作统计 Gameplay Stats

- Target/All toggle. “Target” shows these statistics against the target and “All” against all the enemies in that encounter.
- Critical hits %. It shows the percentage of hits that were critical. If you look at Player 2:example, only 94 % of their hits were critical hits against the target. Useful information, especially for Power classes that scale extremely with critical strikes.
- Flanking hits %. This percentage shows many hits from you were considered a flanking hit for the purpose of traits or runes. Most notable ones are probably 's 6th passive and
 游侠 ’s in the
  游击 。
游击 。

- Times the target got hit while moving. Good to know when you are working with conditions, like
 折磨 ,that deal damage based on whether the target is moving or not (or other abilities)。
 - Time wasted interrupting skill casts. Can be very useful to determine if you are wasting time interrupting your skills. Can also tell you if your ping is a bit wonky if this number is much higher than usual.
- Time saved interrupting skill casts. A lot of skills have very long aftercasts that you can cancel by Stowing, using a different skill, or moving, depending on the skill.
- Average distance to the centre of the squad. Makes it easy to see if someone is consistently far away from the squad.
- Average distance to the commander. At times, useful, more often than not, it’s not useful.
防御统计 Defensive Stats

- Damage taken during the selected period of the encounter. While the damage that you deal is shown as DPS by default, this column shows the total damage taken.
- Damage absorbed by a
 屏障 。 This typically comes from
 providing barrier and shows how much of that barrier was eaten. - Times downed tells you how many times someone downed. Hovering over gives you extra information (most notably, how many seconds they were downed for)。
- Times died tells you whether someone died completely or not (think binary, 0=not dead, 1=yes dead)。 Hovering over gives you an idea of how long they were out of the fight.
辅助统计 Support Stats

- Condition cleanses on others and condition cleanses on yourself. It tells you how many times you cleansed conditions. Helpful information on some condition-heavy fights.
- Boon strips on enemies tells you how many times this person stripped boons from the enemies. Useful information if the enemy has boons (which is true for a few raid encounters) and when you are trying to analyse fractals that have
。 - Resurrections tells you how many times the player resurrected someone. It doesn’t take into account resurrects that are NOT your F-key (or whatever you use for action)。 So res-bot
 或 on a
  won’t show up here.
增益 Buffs
Buffs are probably the BEST thing you can search and look up on a log. Boons tell you very much about the pacing of the fight, the quality of the group, the composition and whether your damage will be good or abysmal. First, let’s go through the settings on top that you can see in the picture below.

阶段持续时间 Vs. 阶段有效持续时间 Phase Duration Vs. Phase Active Duration
While these two have very similar names, they are rather different in the stats that they show. If you have a log where someone dies midway and you select “Phase active duration” you can see that they have better boon uptimes. The reason for this is that when you have only “Phase duration” selected, it shows the boon uptimes for the phase that’s currently selected (from the phase menu that’s always visible)。 If this person is dead in the phase that you have selected, they will have 0 % boon uptimes.
When you select Phase active duration, it shows the boon uptimes on the players for as long as they lived. So if they had quickness for the whole phase and just instantly died, they would have 100 % uptime with “Phase active duration” selected. It also takes into account someone disconnecting.
维持时间 Vs. 增益提供 Uptime Vs. Generation
- Uptime - The uptime of that certain boon in the selected phase. If you select “Phase 1” and check the boon uptime for
 急速 and you see 54.4 %, you had 急速 :54.4 % of the encounter. For stacking boons (namely Might and Stability) it shows you the average amount you had and the uptime when you hover over the number.
 - Generation Self - Shows you how much uptime of a certain boon you produced on yourself.
- Generation Group - Shows how much boon uptime you generated for your subgroup. If it shows 50 % uptime on 急速 :example, it means that the average uptime of 急速 generated by you in your subgroup was 50 %. This selection excludes your personal boons.
- Generation Off-Group - Shows you how much you generated a certain boon to people outside of your subgroup. Not particularly handy information for the most part, but in some niche cases it makes sense. This selection excludes your personal boons.
- Generation Squad - Shows you how much boon uptime on average you generated for your whole squad. For example, a
 can see here how much
  敏捷 they provided to ten people and see if they had some help from somewhere (like
  extending with etc.)。 This selection excludes your personal boons.
浪费,过量 & 延长 Wasted, Overstack & Extension
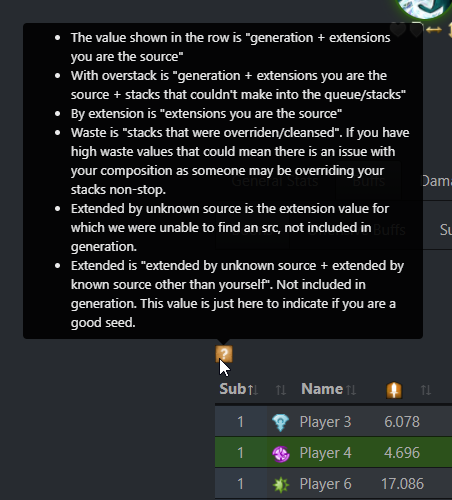
These are all words that you can see when you are looking at any of the generation parts of the logs. What do these words exactly mean then? If you ever need a quick reminder, the orange/yellow tile with a white question mark is there to remind you! When you hover over it, you will see:
The value shown in the row is "generation + extensions you are the source"
With overstack is "generation + extensions you are the source + stacks that couldn't make into the queue/stacks"
By extension is "extensions you are the source"
Waste is "stacks that were overriden/cleansed". If you have high waste values that could mean there is an issue with your composition as someone may be overriding your stacks non-stop.
Extended by unknown source is the extension value for which we were unable to find an src, not included in generation.
Extended is "extended by unknown source + extended by known source other than yourself". Not included in generation. This value is just here to indicate if you are a good seed.
With all this in mind, we should dive into the different categories for buffs. Before we do that, though, I would like to say a word about unique boons/buffs。 These are buffs that are generated by a sole profession (sometimes just one single elite specialisation can provide your squad with this particular unique buff!) and they are usually EXTREMELY strong and capped to 5 people. With that in mind, let’s dive into it.
增益 Boons

In the boons screen you can see, well, all the boons that at least one person in the squad had at any point of the encounter. The uptime part is important to look at when trying to resolve issues with the compositions problems because it tells you exactly how much uptime you had on each boon. It is advisable to select a certain phase on some bosses where giving boons to everyone is rather difficult, like on ![]() 山谷守护者 :example.
山谷守护者 :example.
For more information on what the numbers in the generation sections mean, read Uptime Vs. Generation.
进攻、辅助、防御 & 装备增益Offensive, Support, Defensive & Gear Buffs
This guide touched unique buffs earlier. The unique buffs are something that aren’t stripped from you when you start an encounter in raids, strikes or Fractal 100 (Sunqua Peak)。 They usually consist of consistent damage buffs or something that gives you attributes. They will be divided between the sections according to what they do.
个人增益 Personal Buffs
Personal Buffs has information about the buffs that you had on your buff bar but aren’t boons. It can tell you about your attunements on ![]() or stance on
or stance on ![]() 魂武者 ,for example.
魂武者 ,for example.

It will only show those buffs that appeared on you in this collective table. If you didn’t have a boon that other player(s) with the same class had, it will simply show a “-” in place of a number or a percentage. It can provide you with good information regarding how long you spent in a certain stance or attunement or if your unique buff uptime was decent enough.
伤害加成 Damage Modifiers
Damage modifiers are, well… damage modifiers! In this section of the dps.report you can see exactly how much your DPS was increased (=modified) by different kinds of damage modifiers. Damage modifiers are EXTREMELY important because they are usually in percentages and can add a ton of damage into your bursts. Most notable examples are ![]() Unnatural Signet on
Unnatural Signet on ![]() 戴莫斯 ,where
戴莫斯 ,where ![]() 戴莫斯 takes 100 % increased damage (despite the tooltip stating 200 %) or
戴莫斯 takes 100 % increased damage (despite the tooltip stating 200 %) or ![]() 暴露 ,where the target takes 10 % increased strike (power) damage and 20 % increased condition damage after their defiance bar has been broken. Playing around different encounter-specific damage modifiers can increase your DPS by a huge margin.
暴露 ,where the target takes 10 % increased strike (power) damage and 20 % increased condition damage after their defiance bar has been broken. Playing around different encounter-specific damage modifiers can increase your DPS by a huge margin.
On top of these damage modifiers, it will also tell you how much damage modifiers from your traits and gear have increased your DPS. Here you can see the uptime of certain runes and traits, so it can also indicate rotation problems or healing problems in the squad. Let’s go ahead and break the sections down.
装备伤害加成 Gear Based Damage Modifiers

As you can see in the image above, the damage modifier table shows most of the sources that are available to you. In this section, you only need to look at the modifiers that apply to you specifically. For the most part, you are focusing on the , 和 。 These are the three most common damage modifiers on the first section (“Gear Based Damage Modifiers”)。 Here I recommend practising some hovering, since you can get a lot of additional information about the runes and the calculations from doing this! This section shows all the theoretical buffs but it cannot know which buffs you were affected by.

This is what you see, when you hover over the in the log. It tells you what modifier it takes into account (the 6th passive in this case), what damage it affects and what it is compared against.

When you hover over the number in the log, you can see how many hits out of all of your hits that are counted for this specific rune hit under the circumstances that count. What this basically means is that in this particular log, I hit the enemy boss 338 times when my health was above 90 %. So it increased my power damage by 3.330 %.
共享伤害加成 Shared Damage Modifiers

In this section of the dps.report you will find damage modifiers that are shared (so they affect basically everyone in the squad)。 The list of modifiers you can find here are:
For more information on how to read these numbers, look at the previous section. Here you can see certain statistics about uptime of certain skills (like is the ![]() using ,
using ,![]() sharing )。 Alternatively, you can take a look at how much damage a specific mechanic on a boss inflates your damage by.
sharing )。 Alternatively, you can take a look at how much damage a specific mechanic on a boss inflates your damage by.
职业伤害加成 Class-Based Damage Modifiers

This section shows all* the available options to your specific class. It does not, however, mean that you had these buffs; simply showing them as if you had those buffs. However, you should know your traits well enough to know which of these affect you to see how much they affected your DPS. Same basic knowledge applies here, hover over to see important stuff. “Target” and “All” are the same as “Target” and “Cleave” in other windows.
*It doesn’t show all active buff effect damage modifiers (i.e.
机制 Mechanics
The mechanics window is sometimes really useful, at other times it doesn’t really tell you all that much. Some mechanics you intentionally fail and others just aren’t impactful, whereas some are extremely impactful. Let’s take a look at the image below.

As we can see in this log, there are a lot of abbreviations and initialisms. Worry not, however, if you just hover over the mechanic at the top of the column, it will tell you its name (and sometimes a nickname)。 If you aren’t sure which mechanic it is, the Guild Wars 2 Wiki is your friend as it has a lot of information about all the bosses in raids and fractals, as well as the names of their attacks. In this section we can see that some people triggered the oil (black) on ![]() 戴莫斯 which is really bad! You can also hunt down the person doing that using these logs. The Mechanics Log is a handy plugin (discussed in the beginning of this guide) which allows you to do that in-game so you don’t have to go through the hassle of uploading logs and checking the mechanics tab. Mechanics are important and it’s even more important to notify someone if it’s their 10th time triggering the black when
戴莫斯 which is really bad! You can also hunt down the person doing that using these logs. The Mechanics Log is a handy plugin (discussed in the beginning of this guide) which allows you to do that in-game so you don’t have to go through the hassle of uploading logs and checking the mechanics tab. Mechanics are important and it’s even more important to notify someone if it’s their 10th time triggering the black when ![]() 戴莫斯 is below 13 %!
戴莫斯 is below 13 %!
图表 Graph
There are in fact two different really useful graphs in the dps.report, we will be covering the one first that you can see in the main tabs. Let’s take a look at the graph below.

Here you can see the basic options (selecting a phase from the top of the dps.report also applies here) as well as a few new ones. Let’s go ahead and further break down these choices, what they exactly mean, and how you can use them to analyse your gameplay.
The selections on the right (Full, 4s, 10s, 20s, 30s and phase) are a timeframe that you are setting for the graph. The selection in the middle is what the graph is showing (combined damage, direct damage, condition damage and breakbar damage)。 The last selection is on the right and it determines whether the values are per second (and centered per second) or the combined damage.
What do these mean in practice? First we should look at the selections on the right. Assuming you have selected “4s” on the left and combined DPS in the middle, it changes slightly between normal DPS and centered DPS, since centered just means that the DPS is centered on “now”. You can see the graph make a slight shift once you select the “centered DPS” instead of the default “DPS”. If you selected “Damage” instead of either of the DPS selections, it will show the damage that has accumulated over the past x seconds where the x is the time
Now if we look at the time selection on the left, we have a few choices. “Full” means the full fight and “Phase” means per phase. However, selecting one of the choices with determined time will make the graph show you the average DPS or damage done x seconds prior to this point. So if you were to select 10s and “DPS” you would see the average damage done during 10s before now”. If you swap to “Centered DPS” you would see the same, but centered on now. Selecting “Damage” would tell you damage done in the timeframe of 10 seconds prior to the selected point on the graph (i.e. you hover over 15s, you would see damage done between seconds 5s and 15s of the fight)。
You can also select and deselect certain lines from showing. If you take a look at the image below, the ones that are highlighted are on the chart, but those that are dimmed out you cannot see on the chart. It is a nice way to select what information you would want to see. In this particular case, for example, downed statuses on players. You wouldn’t be able to see breakbars on the chart because it is dimmed out.

<media type="video" src="https://assets.snowcrows.com/images/guides/getting-started/graph_usage.mp4]
Quick note on the usage of the graph. You can click and drag to zoom in on that part of the graph. To reset to the original zoom, double-click on the graph. You can move on the horizontal and vertical axes by hovering over the axis until a two-way arrow appears. Then you can hold and drag to move on those axes. These tips work across the graphs you can see on dps.report.

This handy bar you will see if you hover over a graph. It has many options for selection, zooming and exporting as a png-file, for example! They are pretty self-explanatory as you read their names when you hover over them. They are maybe a bit less intuitive to use compared to the controls shown before.
循环 Rotations
The rotations tab is a quite new addition to the Elite Insights Parser and dps.report. Every players’ rotations can be seen next to each other, making it easy to see what people did during certain parts of the fights. It’s not particularly easy to read and the information isn’t all that useful since it does show everything that the players did. However, it can be somewhat useful if you are trying to see if someone used a damage modifying ability at the right time relative to someone else’s burst or something along those lines.

目标总结 Targets Summary
The Targets Summary lives up to its name. It is a very nice summary of the target of the encounter (in this case, the ![]() 山谷守护者 )。
山谷守护者 )。
伤害分布 Damage Distribution

Min, Avg and Max help you tell how much damage a specific skill from the boss dealt to the group.
- Min - The minimum damage that this skill dealt. E.g. 山谷守护者 hit with :100, 200 and 300 damage. This means that this column would show 100 as the minimum damage.
- Avg - Average damage that this skill dealt. Basic formula would be (damage dealt by skill)/(skill hits)。
- Max - Same as minimum damage, but for the maximum. In the example seen for the minimum damage value (100, 200 and 300), this column would show 300.
Here you can see casts, hits and hits per cast, respectively. Casts means how many times an ability was cast (including failed casts)。 In the picture above you can see that ![]() 山谷守护者 cast its skill 24 times. It hit a total of 55 times. If we hover over the amount of hits, we can see another statistic: it tells us that 20 hits were not connected (meaning that they were dodged or the target was invulnerable)。 The last column in this highlighted section is hits per cast, which is a simple maths equation again: (hits)/(casts)。
山谷守护者 cast its skill 24 times. It hit a total of 55 times. If we hover over the amount of hits, we can see another statistic: it tells us that 20 hits were not connected (meaning that they were dodged or the target was invulnerable)。 The last column in this highlighted section is hits per cast, which is a simple maths equation again: (hits)/(casts)。
- This column tells you how much damage you deal for each second of the cast time: (damage)/(cast time)。 It is helpful to tell you how effective in reality your skills have been, although it is not the best indicator in all situations.
The first tab is the “Damage Distribution” tab where you can see how the target dealt damage and how much. Hover over the damage dealt to see the DPS of that particular boss skill. You can also see that there is another tab for Damage Distribution called ![]() 山谷守护者 and deal some damage as well. You can see here how much damage they dealt to the group to analyse seeker control, since the damage from them does add up rather quickly.
山谷守护者 and deal some damage as well. You can see here how much damage they dealt to the group to analyse seeker control, since the damage from them does add up rather quickly.
承受伤害 Damage Taken
Damage taken section simply shows how much damage the target took and from which sources. It is helpful in determining where your group's damage came from and how effective certain damage modifiers actually were (like 和 )。
图表 Graph
This graph is a bit different from the graph we saw earlier. It shows this encounter from the target’s point of view rather than the squad’s point of view. It is not the most useful graph for most encounters, but for encounters where the enemy can gain boons or certain unique buffs due to failed mechanics or other causes, it can show you when they got them which can help troubleshoot your group's failures. Read more about how to read graphs in the Graph section above.
增益状态 Buff Status
The buff status section is rather interesting and shows relatively useful statistics, especially for those aforementioned boons. Here is a view from a Skorvald The Shattered log, where there was a

As you can see, there is a “Boons” section to this Buff Status section now, which tells us that the boss had boon uptime, like ![]() 保护 ,on it. This is a good statistic to see how effective your group was in stripping the enemies of boons, as
保护 ,on it. This is a good statistic to see how effective your group was in stripping the enemies of boons, as ![]() 保护 is a large buff to one’s defence.
保护 is a large buff to one’s defence.

In raids there are a few encounters where the enemy bosses can get boons. These are, for example, ![]() 卡迪姆 ,
卡迪姆 ,![]() 无可匹敌的卡迪姆 ,
无可匹敌的卡迪姆 ,![]() 基石守护者艾迪娜 和
基石守护者艾迪娜 和 ![]() 多变藤戈瑟瓦尔 。 Here you can see whether the bosses are getting boons and if you know how they get them, you can deduct if something went wrong in the raids. For example, on
多变藤戈瑟瓦尔 。 Here you can see whether the bosses are getting boons and if you know how they get them, you can deduct if something went wrong in the raids. For example, on
In the same view you can see the conditions generated on the boss by players. It is handy if you are trying to analyse, for example, the ![]() 困惑 generation by
困惑 generation by ![]() on a golem.
on a golem.
玩家总结 Player Summary
For Damage Distribution and Damage Taken, read their respective articles above.
图表 Graph
This graph is very (VERY) good for analysing your logs and your personal performance.

In this graph, you have an abundance of selections that you can make on the right to see your boon uptimes, unique buff uptimes, debuffs, consumables, cleave, target, breakbar… almost everything! Like other graphs, it is usable with the previous tips that you can find in the other graph section. I personally think that this is a good place to look at to see very important details about your own performance (as well as to get an idea of how well your supports and healers performed)。
简化循环 Simple Rotation
Simple rotation is there to show you your (almost) entire rotation throughout the encounter. Some skills are undetectable by the parser, especially instant cast skills. As before, selecting a phase from the phase selector will also affect this view.

This is my own simple rotation, so you can tell that I am by no means a ![]() player. With that being said, you can see that this has some nice colouring here and there are, again, a few other selections that you can make at the top.
player. With that being said, you can see that this has some nice colouring here and there are, again, a few other selections that you can make at the top.
Here you can select a few options. Let’s go through them bit by bit:
- Show auto attacks - Does what the name sort of implies. If you don’t have this selected, the second option doesn’t matter as there are no auto attacks shown on the rotation page if you deselect this one. Auto attacks are the attacks that are on your (by default) hotkey “1”.
- Hide interrupted auto attacks. You can see on the graph that there are auto attacks with a red outline. That means that they were cancelled. This can indicate a lot of things.
- Hide instant cast - Hides… Instant casts? Yes, it hides instant casts. Instant cast skills are skills that aren’t channeled and happen instantaneously after pressing them (i.e. )。
- Small icons - Makes the icons all small.
- Small auto attack icons - Makes only the auto attack icons small.
Here is an explanation from the dps.report itself on the outlines of the icons:

消耗品 Consumables

The Consumables section shows you your consumables and if you swapped them in the middle of the combat, or if they perhaps ended while you were still in combat. It shows the consumables and their remaining times. This list is maintained by hand so if some of the food effects are missing, it’s due to them not being manually added to the list. The Elite Insights Discord will probably be able to help you if you notice a missing consumable.
死亡回放 Death Recap

Death recap shows you the context of one's death. It tells you the damage taken over time leading to death and how many seconds the person was in downstate and the damage that they took while in downstate. The important part of this graph is probably the circumstances leading to death, as you can see if someone is failing mechanics or standing in the wrong place and soaking up a lot of damage. It will also tell you exactly which skill killed someone in case there is some uncertainty about it.